Category Archives: Admixture - Page 11

Harappa Maps

Simranjit has generated new isopleth maps from the latest K=12 admixture run.

C1 South Asian:

C2 Balochistan/Caucasus:

C5 Southwest Asian:

C6 European:

Simranjit's also creating isoclusters now which classify different points/regions into clusters based on the admixture results Simran is using from here. Here's an isocluster map with 15 clusters inferred from the K=12 admixture results of reference populations and Harappa participants.

You can see the dendrogram showing the distance between the clusters on his blog.

Admixture K=12, HRP0071-HRP0080

Here are their ethnic backgrounds and the results spreadsheet. Also relevant are the reference I admixture results.

If you can't see the interactive bar chart above, here's a static image.

Since I don't have any Native American samples in my reference populations, the Brazilian participant (HRP0074) shows up as having Northeast Asian and Siberian.

PS. This was run using Admixture version 1.04.

Admixture K=4, HRP0071-HRP0080

Here are their ethnic backgrounds and the results spreadsheet. Also relevant are the reference I admixture results.

The interesting samples here are Gujarati (HRP0071), Bengali Brahmin (HRP0077) and Brazilian (HRP0074).

If you can't see the interactive bar chart above, here's a static image.

PS. This was run using Admixture version 1.04.

Ref2 South Asian + Harappa Admixture

Using the reference II dataset of 548 South Asians and 38 Harappa Project South Asians that I have been working on, I ran Admixture.

The optimum number of ancestral components was 5-6. So I used K=6. The components are highest among the following groups:

C1 Brahui, Makrani, Balochi C2 TN Dalit, North Kannadi
C3 Irula C4 Gujaratis
C5 Hazara C6 Kalash

I consider the Irulas, a Scheduled tribe from Tamil Nadu, to be problematic in a similar way to the Kalash except that the Irulas are well-scattered in their own space in the PCA plot.

Also, note that all the European, West Asian, etc is being represented by C1. Similarly, all the East Asian ancestry is being collected in C5.

The spreadsheet showing the admixture results is here. The first sheet shows the individual results for the project participants.

The 2nd sheet shows the average (and standard deviation) for the reference populations.

The 3rd sheet shows the average and standard deviation for each cluster computed by MClust from PCA.

The 4th sheet shows the average and standard deviation for each cluster computed by MClust from MDS.

Also, take a look at the admixture percentage standard deviations. You'll notice that those are generally lower for the clusters compared to the population groups.

Supervised Continental Admixture

Since the version 1.1 of Admixture with supervised option came almost two months ago, I have been salivating over it.

My original use case for it is not possible (for now). I wanted to be able to assign a few of the K ancestral components to specific reference populations and let the other ancestral components fall where they may. But we can do supervised admixture only by assigning all K ancestral components.

So I decided to test this supervised option by mimicking the three continental percentages 23andme assigns you on their ancestry painting page. Mine are:

Europe 91.22%
Asia 8.69%
Africa 0.09%

You can get the extra precision (and false sense of accuracy) here.

Regarding the reference populations used for ancestry painting, 23andme says:

23andMe takes advantage of publicly available data for four populations studied extensively via the International HapMap project (hapmap.org). That project obtained the genotypes for 60 individuals of western European descent from Utah, 60 western African individuals from Nigeria, and 90 eastern Asian individuals, 45 from each of Japan and China. Because the two eastern Asian populations are geographically near one another and relatively similar at the genetic level, 23andMe combines these to form a single eastern Asian reference population.

So I dug up my reference admixture run at K=3 and found the same number of samples of these HapMap populations by looking for those samples which had the highest percentage in the respective component.

Then I combined these 210 samples from the HapMap with 74 Harappa Project participants (HRP0001 to HRP0079, excluding 5 who are related to others).

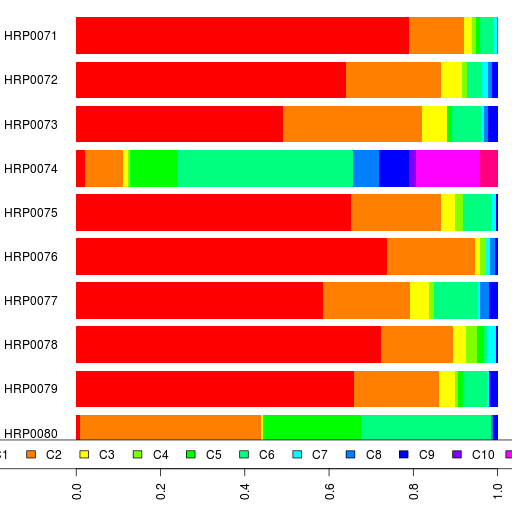
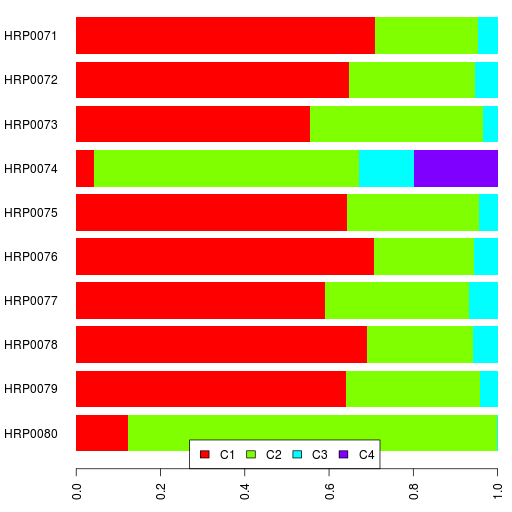
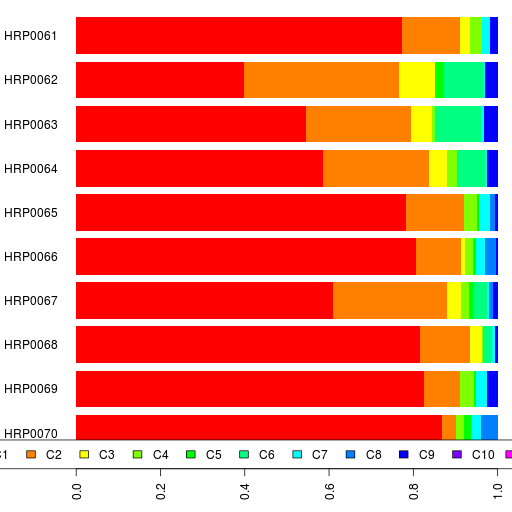
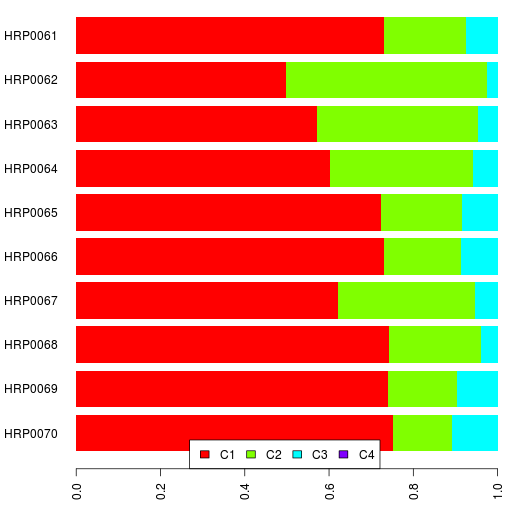
The results of the supervised admixture run are in a spreadsheet and also shown in a bar chart below.

Since I did run an unsupervised K=3 admixture analysis of the first Harappa batch with the whole reference I populations, you can compare these results to those.

Harappa Maps

Here are a couple of more maps of the South Asian admixture component from Simranjit incorporating the latest Harappa results.

He's posted more maps at his blog.

Admixture K=12, HRP0061-HRP0070

Here are their ethnic backgrounds and the results spreadsheet. Also relevant are the reference I admixture results.

If you can't see the interactive bar chart above, here's a static image.

I dare you to generalize!

PS. This was run using Admixture version 1.04.

Admixture K=4, HRP0061-HRP0070

Here are their ethnic backgrounds and the results spreadsheet. Also relevant are the reference I admixture results.

The interesting samples here are the Gujarati and the Punjabi. HRP0064 is very different from the other Punjabis so far.

If you can't see the interactive bar chart above, here's a static image.

PS. This was run using Admixture version 1.04.

Admixture K=17 maps: Mediterranean and Southwest Asian

From the Reference I K=17 Admixture results, Simranjit has created more isopleth maps.

Mediterranean component:

Southwest Asian component:

Iranians

Since we have 7 Iranians in the project, it's time to look at them as a group. We also have 19 Iranians from the Behar et al dataset.

Let's look at their admixture results at K=12.

The big difference between Harappa Project Iranians and Behar et al Iranians is African admixture. Only one Harappa Iranian (HRP0046) has 1% African admixture while three Behar Iranians have more than 10%.

Let's do hierarchical clustering with complete linkage using the Euclidean distance between admixture components. First a caveat or two. This is not a phylogeny. Also, the Euclidean distance measure is not a good one for measuring differences in admixture but I am not sure what would be better.

HRP0010 who is an Assyrian actually clusters better with Caucasian, Iranian and Iraqi Jews than with Iranians.

I'll run an MDS or PCA of the whole region from Punjab/Kashmir to the Levant and Caucasus soon which should be more interesting for clustering.

UPDATE: Since Palisto wondered, I checked and found out that he, an Iraqi Kurd, is very like the Iranians in his admixture result. So I have included him (HRP0059).