Category Archives: Admixture - Page 13

Balochistan/Caucasian

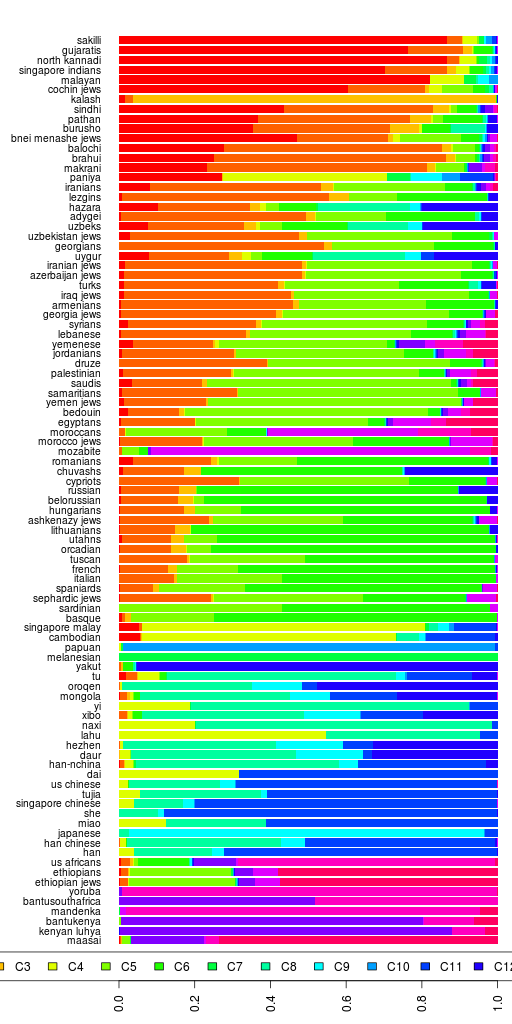
There has been some discussion in the comments about the C2 ancestral component at K=12 admixture runs which I called Pakistani/Caucasian.

First of all, we should remember that these "names" of ancestral populations are just rough mnemonics. They are chosen based on the frequencies of the component among modern reference samples. So the names have nothing at all to do with history.

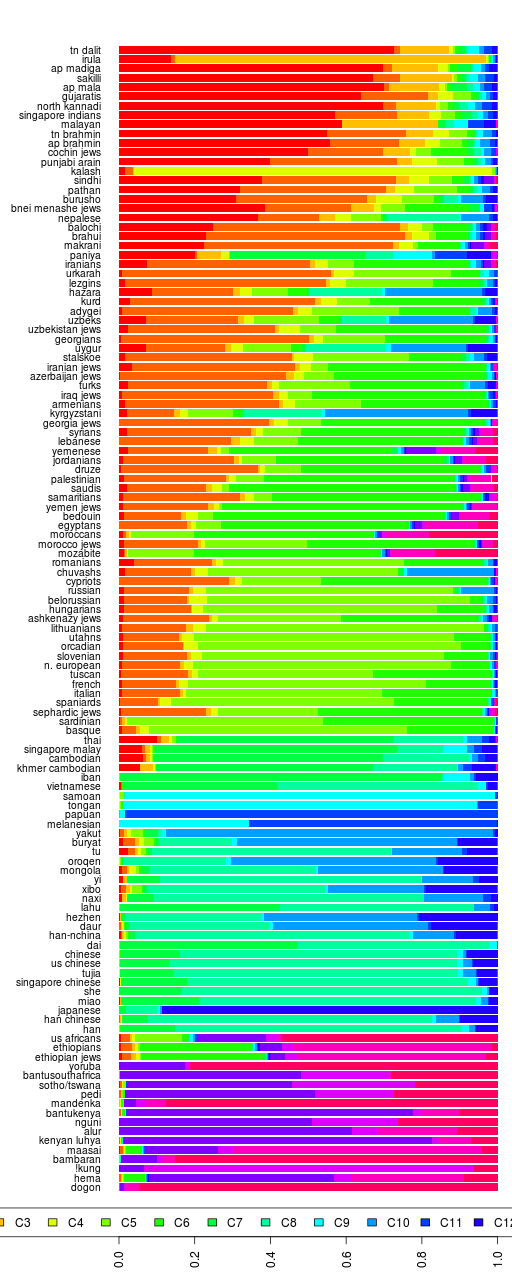
In the case of Pakistani/Caucasian component, I wanted to emphasize the peaks of the component in Pakistan and the Caucasus. As commenters pointed out, the component is also quite high among the Iranians.

However, I have realized that this name, Pakistani/Caucasian, is a hindrance rather than a help for understanding the Admixture results. Also, this component is lower among the Pathan, Sindhis, and Punjabis than it is for Iranians etc. Therefore, the Pakistani part of the name is a bit of a misnomer, considering that the Pakistani populations it is high among comprise only about 5% of the country's population.

On the other hand, I do not like the name "Iranian" for this component. While it was suggested based on the geographical Iranian plateau which extends from the Caucasus to Balochistan, it still is confusing and it doesn't emphasize the peak areas.

Thus, I have renamed "Pakistani/Caucasian" as "Balochistan/Caucasus". I didn't use the shorter Baloch as this component is equally high among the Baloch, Brahui and Makrani, all populations living in the province of Balochistan.

Reference I Admixture Analysis K=16

Continuing with Reference I admixture analysis, here is the results spreadsheet.

You can click on the legend to the right of the bar chart to sort by different ancestral components.

If you can't see the interactive chart above, here's a static image.

C1 South Asian C2 Balochistan/Caucasus
C3 Kalash C4 Southeast Asian
C5 Southwest Asian C6 European
C7 Melanesian C8 Naxi/Yi
C9 Japanese C10 Papuan
C11 She C12 Siberian
C13 Eastern Bantu C14 Northwest African
C15 West African C16 East African

Things are breaking down now, with the East Asian components breaking up. The usefulness of higher K's is doubtful. I am going to run K=17 on this dataset and then focus on more filtered data.

Fst divergences between estimated populations for K=16:

Here are the Fst numbers:

C1 C2 C3 C4 C5 C6 C7 C8 C9 C10 C11 C12
C2 0.053
C3 0.064 0.060
C4 0.076 0.112 0.123
C5 0.073 0.056 0.085 0.130
C6 0.064 0.040 0.073 0.118 0.048
C7 0.164 0.200 0.215 0.165 0.217 0.206
C8 0.087 0.122 0.133 0.045 0.140 0.127 0.181
C9 0.081 0.117 0.128 0.036 0.135 0.122 0.172 0.021
C10 0.184 0.222 0.237 0.200 0.238 0.227 0.145 0.215 0.207
C11 0.083 0.119 0.130 0.023 0.137 0.125 0.171 0.025 0.017 0.209
C12 0.086 0.114 0.127 0.063 0.133 0.118 0.189 0.048 0.041 0.221 0.048
C13 0.145 0.153 0.177 0.181 0.156 0.162 0.257 0.192 0.186 0.275 0.188 0.191
C14 0.079 0.063 0.096 0.127 0.052 0.056 0.211 0.138 0.132 0.232 0.134 0.132
C15 0.153 0.162 0.186 0.189 0.166 0.172 0.265 0.201 0.195 0.283 0.197 0.200
C16 0.106 0.108 0.135 0.145 0.106 0.116 0.223 0.156 0.150 0.241 0.152 0.154
C13 C14 C15
C14 0.116
C15 0.013 0.122
C16 0.034 0.079 0.041

PS. This was run using Admixture version 1.04 so I can make an apples-to-apples comparison with the previous runs.

Singapore Indians

In the South Asian PCA plot, we saw that Singapore Indian samples from the SGVP dataset had a lot of diversity. Let's zoom into that plot so it's not dominated by the distinctiveness of the Kalash.

Eigenvector 1 explains 1.45 times the variation compared to eigenvector 2.

We see that Singapore Indians are spread in the whole region from Sindhis to North Kanaddi.

Now let's look at the individual admixture results (at K=12 ancestral populations) for the Singapore Indians. I have added some South Asian reference population averages so you can place them in context.

You can click on the legend to the right of the bar chart to sort by different ancestral components.

From these results, a majority of the Singapore Indian samples look South Indian but there are definitely a few from the northwest of the subcontinent (Punjabis or Sindhis?) There are also a few who could be from the Hindi belt.

There are 2-3 samples who have a significant amount of Southeast Asian. Could they be originally from Bengal? Or could they have partial Singapore Malay ancestry?

Reference I Admixture Analysis K=15

Continuing with Reference I admixture analysis, here is the results spreadsheet.

You can click on the legend to the right of the bar chart to sort by different ancestral components.

If you can't see the interactive chart above, here's a static image.

C1 South Asian C2 Balochistan/Caucasus
C3 Kalash C4 Southeast Asian
C5 Southwest Asian C6 European
C7 Melanesian C8 Japanese
C9 Siberian C10 Papuan
C11 Chinese C12 Eastern Bantu
C13 Northwest African C14 West African
C15 East African

The new Northwest African component is mostly Mozabite, though it is present among Moroccans too.

Fst divergences between estimated populations for K=15:

PS. This was run using Admixture version 1.04 so I can make an apples-to-apples comparison with the previous runs.

UPDATE: Here are the Fst numbers:

C1 C2 C3 C4 C5 C6 C7 C8 C9 C10 C11 C12 C13 C14
C2 0.053
C3 0.064 0.060
C4 0.081 0.116 0.129
C5 0.073 0.056 0.085 0.135
C6 0.065 0.040 0.073 0.123 0.048
C7 0.164 0.200 0.215 0.171 0.217 0.205
C8 0.080 0.116 0.128 0.035 0.135 0.122 0.172
C9 0.084 0.113 0.126 0.064 0.133 0.117 0.188 0.040
C10 0.184 0.222 0.237 0.208 0.238 0.227 0.145 0.207 0.219
C11 0.083 0.119 0.130 0.030 0.137 0.125 0.173 0.014 0.044 0.209
C12 0.145 0.153 0.177 0.185 0.156 0.162 0.257 0.186 0.190 0.275 0.188
C13 0.079 0.063 0.096 0.132 0.052 0.056 0.210 0.132 0.131 0.232 0.135 0.116
C14 0.153 0.162 0.186 0.194 0.166 0.172 0.265 0.195 0.199 0.283 0.197 0.013 0.122
C15 0.106 0.108 0.135 0.149 0.106 0.116 0.223 0.150 0.153 0.241 0.152 0.034 0.079 0.041

Admixture K=12, HRP0041-HRP0050

Here are their ethnic backgrounds and the results spreadsheet. Also relevant are the reference I admixture results.

If you can't see the interactive bar chart above, here's a static image.

PS. This was run using Admixture version 1.04.

Admixture K=9, HRP0041-HRP0050

Here are their ethnic backgrounds and the results spreadsheet. Also relevant are the reference I admixture results.

The interesting samples here are the two Iraqi Arabs (HRP0042 & HRP0043) who have some African admixture.

If you can't see the interactive bar chart above, here's a static image.

PS. This was run using Admixture version 1.04.

Admixture K=4, HRP0041-HRP0050

Here are their ethnic backgrounds and the results spreadsheet. Also relevant are the reference I admixture results.

The interesting samples here are the two Iraqi Arabs (HRP0042 & HRP0043) who have some African admixture.

Also, we finally have a couple of Bengalis (HRP0049 & HRP0050) who have 13% East Asian for this run which is less than Razib's (HRP0002) and his parents' 19-20% but still higher than others.

If you can't see the interactive bar chart above, here's a static image.

PS. This was run using Admixture version 1.04.

Reference II Admixture Analysis K=16

Continuing with Reference II admixture analysis, here is the results spreadsheet.

You can click on the legend to the right of the bar chart to sort by different ancestral components.

If you can't see the interactive chart above, here's a static image.

C1 South Asian C2 Balochistan/Caucasus
C3 Irula C4 Kalash
C5 European C6 Southwest Asian
C7 Southeast Asian C8 Chinese
C9 Polynesian C10 Siberian
C11 Papuan C12 Japanese
C13 Eastern Bantu C14 Bushman
C15 East African C16 West African

Fst divergences dendrogram between estimated ancestral populations for K=16:

PS. This was run using Admixture version 1.04 so I can make an apples-to-apples comparison with the previous runs.

Reference II Admixture Analysis K=15

Continuing with Reference II admixture analysis, here is the results spreadsheet.

You can click on the legend to the right of the bar chart to sort by different ancestral components.

If you can't see the interactive chart above, here's a static image.

C1 South Asian C2 Balochistan/Caucasus
C3 Kalash C4 Southwest Asian
C5 European C6 Southeast Asian
C7 Chinese C8 Polynesian
C9 Siberian C10 Papuan
C11 Japanese C12 Eastern Bantu
C13 Bushman C14 East African
C15 West African

Fst divergences dendrogram between estimated ancestral populations for K=15:

PS. This was run using Admixture version 1.04 so I can make an apples-to-apples comparison with the previous runs.

Reference II Admixture Analysis K=14

Continuing with Reference II admixture analysis, here is the results spreadsheet.

You can click on the legend to the right of the bar chart to sort by different ancestral components.

If you can't see the interactive chart above, here's a static image.

C1 South Asian C2 Balochistan/Caucasus
C3 Kalash C4 Southwest Asian
C5 European C6 Southeast Asian
C7 Chinese C8 Polynesian
C9 Siberian C10 Papuan
C11 Japanese C12 West African
C13 East African C14 Bushman

Fst divergences dendrogram between estimated ancestral populations for K=14:

PS. This was run using Admixture version 1.04 so I can make an apples-to-apples comparison with the previous runs.